
Compiling insights into learner profiles
Creating better assessments is only one piece of the puzzle. We must also deliver information back to teachers in ways that are meaningful and actionable.
With the right design, digital learning activities can reduce the amount of student work that teachers review and score.
But how can teachers still get enough detail about student activity to help them assess student progress while avoiding data overload?
Over the course of a school day, teachers make countless instructional decisions that affect learning outcomes. They use all kinds of data — from anecdotal observations to assessment results — to guide their decision-making.
While the path from data to decisions is complex, research tells us that data interpretation is an important step.
Presenting insights from high-quality assessments, homework, online programs, and more into clear learner profiles can help teachers personalized learning through data-driven instruction.
Dive deeper into this topic
Developing learner profiles
The first step is to identify what it is we want to know about the learner. Consider what knowledge, skills, and attributes do you want to include in your progress monitoring efforts.
Start with your objectives
In order to determine what should be in the profile, it is useful to think about how the profile will be used.
Teachers need to get information about student progress in a meaningful way.
This Learner Profile component was part of a Pearson research project and we designed it to answer several key questions that teachers have on a daily basis:
- Who is struggling? With what?
- How can I group my students to improve their learning?
- What should I focus on in my whole class instruction?
- How can I personalize learning for my students?
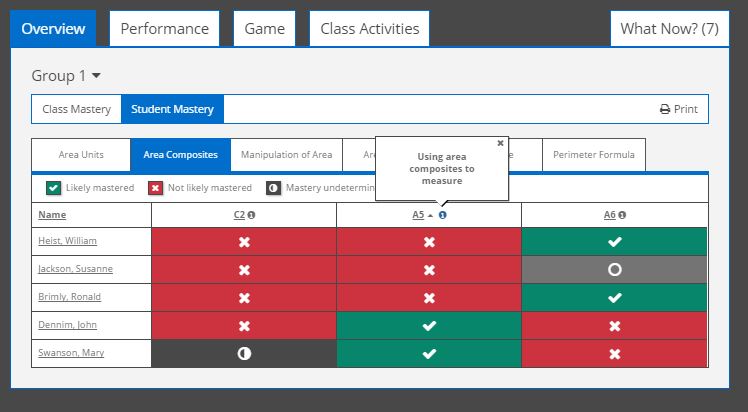
The color coding indicates stages of the learning progression that have been mastered and not mastered so that teachers can decide where to focus their instruction, either at the individual or class level.
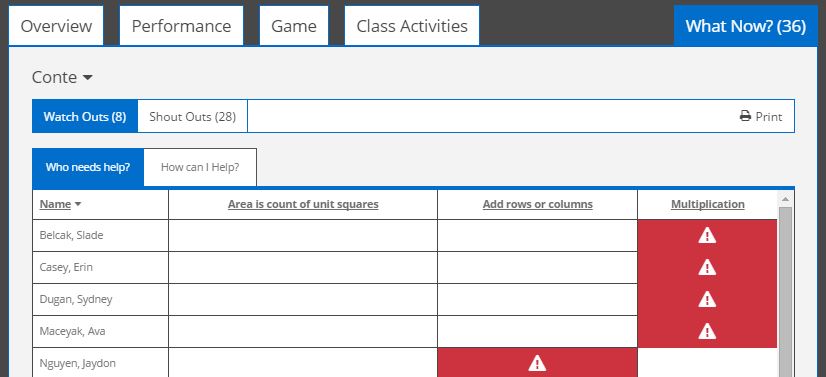
The profile also provides “watch outs” and “shout outs” so that teachers can see which students need attention, either for additional help or an additional challenge.
The Learner Profile was built as a graphical, interactive representation that layers on student performance information.
Prior to administering the unit, teachers are provided with rich professional development on how to interpret and effectively utilize the Learner Profile so that it is accessible, meaningful, and actionable.
Interpreting student information
Teachers are not statisticians, and they shouldn’t have to be. That is why we are working to find ways to provide detailed information in a clear, informative way.
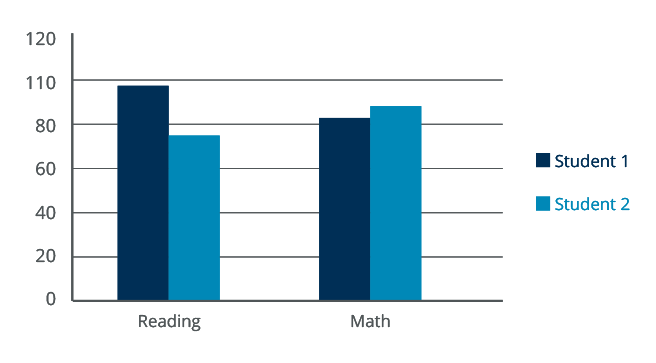
We know that student performance scores can be used to support many different types of decisions, but the way they are usually displayed doesn’t support those decisions. Research on graphical display of information tells us that different displays, or visualizations, are good for different things.
For instance, bar charts are good for making decisions about relative position of two individuals or groups (who did better).
However, bar charts are not useful for making decisions related to absolute standards. Research on interpretation of graphs and the creation of communication tools rather than score reports can help support data-driven instruction and improve learning outcomes.

Teachers’ Ability to Use Data to Inform Instruction: Challenges and Supports
This report by the U.S. Department of Education concludes that a better understanding of teachers’ strengths and weaknesses in understanding data can inform the design of more effective teacher training and professional development.